Afterward I was quite embarrassed to find out all the new gadgets and technology I could have used.

lol. Well, this isn't the first time I've done something like this. The graph below was created through a long process involving multiple conversions. Each line probably took me 30-45 mins to add. The graph above with just Whitney & Half Dome probably only took me 20 mins. If I had not created the bottom image, it would've taken me less than 5 mins once I had the GPX files.
Thanks Dr. Lankford!
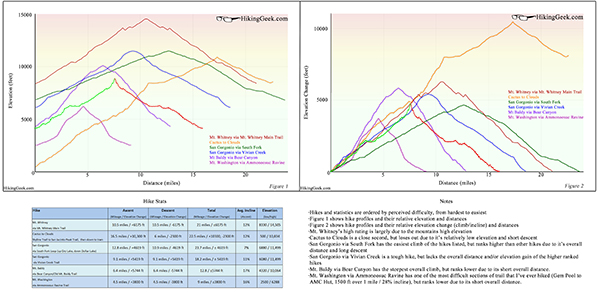
Last year I made a graph showing my most difficult hikes over an 18 month period. I've added Half Dome to the graph (eyeballed it, so its approximate). It's been quite some time since I've done Half Dome and I am much more prepared for my hikes these days, but I'd say that Half Dome was easier than all of the hikes listed, except for Mt. Washington. Mt. Washington and Half Dome are also the only hikes that AMS isn't a factor (for me anyway). Another telling fact is that I find Whitney to be much a harder hike than Cactus to Clouds, even though C2C involves a much longer climb with more overall elevation gain (look at the graph on the right).
The graph is cluttered, but you should be able to figure out which line represents Half Dome. I only added the line for the elevation profile. The text refers only to the other hikes listed.